Посмотрите Culture Corner 1 № 1 ГДЗ Spotlight Английский 11 класс Афанасьева О.В.
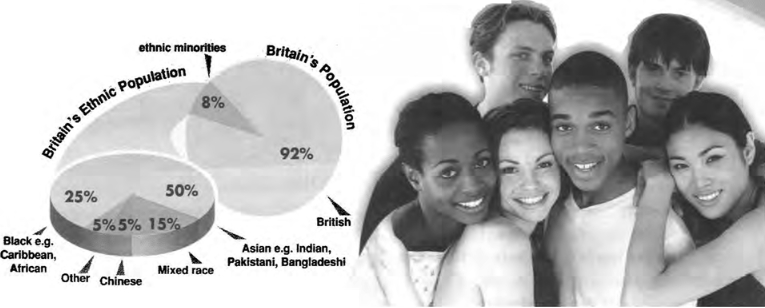
Look at the pie chart. What information does it give us about the ethnic population in Britain?
“My grandparents first came to Britain from India in 1962 to work in a factory, so I'm third generation British-lndian. I speak Gujarati with my family and enjoy going to huge Indian weddings at the community centre or taking part in Hindu festival celebrations such as Diwali, but I have a lot of friends and interests outside the community, too. I've heard recently that more than a third of people living in my city, Leicester, today are migrants1 or second or third generation migrants. So, it's set to be the first city in the UK where ethnic minority groups will make up the majority!"
Rupa, 16
"When people ask me where I'm from, I say I'm British, even though I'm of Chinese origin. I used to live in a small town and I got picked on a bit because I looked different, but now I live in Newham in East London, which is the most culturally diverse place in the United Kingdom. At school, half of the pupils speak English as a second language. Our next door neighbours are from Poland. They came to Britain with their 15 year-old boy just after Poland became part of the E.U."
Li, 17
"My parents are from Jamaica, but they have been living in England since they were young. I was born and brought up in Birmingham, England. When the first Caribbeans were invited to come to Britain for work in the late 1940s, there was quite a lot of racism2, and it was hard for Caribbeans to find well-paid work. Nowadays, the Caribbean community is one of the most integrated in Britain. Racism isn't unheard of, of course, but you only have to see how many mixed-race marriages there are now and how many second and third generation Caribbeans are household names on TV to understand how much things have changed."
Understanding a pie chart
• Focus Ss' attention on the pie chart. Explain
that a pie chart is used to illustrate the relative
proportions of a group of things.
• Ss work in pairs. Allow Ss some time to look at
the pie chart and discuss how Britain's
population is made up.
• Invite pairs to comment to the class.
Answer Key
The pie chart tells us about the variety of
races that have found a home in Britain. Half
of Britain’s ethnic population is Asian, a
quarter is Black, 15% is of mixed race, 5% is
Chinese and 5% is something else.
Привет всем! Нужен ваш совет, как отвечать…
На рисунке 24 отражено изменение биржевой стоимости акций горнодобывающей компании в (Подробнее...)
Что говорится в задании ?
Portfolio: Now write an e-mail about yourself.
Кто переведет песенку ? (Подробнее...)
Ребята, как сделать задание?
Назовите слова, с помощью которых в этом маленьком рассказе вы-
ражается отношение к персонажам (Подробнее...)
a) Read the model. Match the headings to the paragraphs: A personality & justifications, В comments & feelings, C name (Подробнее...)


